TL Consulting Group

data engineering

Key Considerations for Data Ingestion into the Data Lakehouse

For organisations building Data Lakehouse platforms, an important consideration is defining a structured approach to designing data ingestion patterns, encompassing best practices for each data workload that is ingested into the Data Lakehouse environment. This is crucial for organisations looking to scale with big data analytics and enable more data consumers to perform efficient decision-making, with access to enriched data in real-time. In this article, we explore some of the best practices, key considerations and common pitfalls to avoid when defining the data ingestion patterns into the Data Lakehouse platform. The Data Lakehouse Paradigm The Data Lakehouse is a modern architecture that merges the expansive storage of a Data Lake with the structured data management of a Data Warehouse. The Data Lakehouse is the latest paradigm in Data Platform Architecture, combining the capabilities and benefits of the Data Warehouse and Data Lake into a flexible, comprehensive, and unified platform to serve many use cases including: Defining the data ingestion design patterns for the Data Lakehouse requires defining a structured approach to collect and manage data workloads in the lakehouse while ensuring there are robust data quality and security controls in place as part of the data ingestion. Key Considerations for Data Ingestion Patterns: Common Pitfalls to Avoid Conclusion In summary, the Data Lakehouse is a pathway to unlocking the full potential of your data, fostering innovation, and driving business growth. With the right components and strategic approach, your organisation can leverage Data Lakehouses to stay ahead of the curve, while maintaining a unified, cost-effective data platform deployed on your Cloud environment. Designing correct data ingestion patterns will enable the Data Lakehouse platform to run efficient and scalable data pipelines to serve big data analytics use cases. TL Consulting are a solutions partner with Microsoft in the Data & AI domain. We offer specialised and cost-effective data analytics & engineering services tailored to our customer’s needs to extract maximum business value. Our certified cloud platform & data engineering team are tool-agnostic and have high proficiency working with traditional and cloud-based data platforms. Refer to our service capabilities to find out more.

Key Considerations for Data Ingestion into the Data Lakehouse Read More »

Data & AI, , , , , , , ,
data-lakehouse

Harnessing the Power of the Data Lakehouse

As organisations continue to collect more diverse data, it is important to consider a strategic & viable approach to unify and streamline big data analytics workloads, ensuring it is optimised to drive data-driven decisions and enable teams to continue innovating and create a competitive edge. Traditionally, data warehousing has supported the need for ingesting and storing structured data, and the data lake as a separate platform for storing semi-structured/unstructured data. The data lakehouse combines the benefits and capabilities between both and bridges the gap by breaking silos created by the traditional/modern data warehouse, enabling a flexible and modern data platform to serve big data analytics, machine learning & AI workloads in a uniform manner. What is a Data Lakehouse? A data lakehouse is a modern architecture that merges the expansive storage of a data lake with the structured data management of a data warehouse. Data lakehouse platforms offer a comprehensive & flexible solution for big data analytics including Data Engineering and real-time streaming, Data Science, and Machine Learning along with Data Analytics and AI. Key Benefits of Implementing a Data Lakehouse: There are many benefits that can be derived from implementing a data lakehouse correctly: Azure Data Lakehouse Architecture: The following are some of the key services/components that constitute a typical Data Lakehouse platform hosted on Microsoft Azure: Key Considerations when transitioning to a Data Lakehouse: The following are key considerations that need to be factored in when transitioning or migrating from traditional data warehouses/data lakes to the Data Lakehouse: Implementing a Data Lakehouse: Quick Wins for Success The following are small, actionable steps that organisations can take when considering to implement a Data Lakehouse platform: Conclusion In summary, the data lakehouse is a pathway to unlocking the full potential of your data, fostering innovation, and driving business growth. With the right components and strategic approach, your organisation can leverage Data Lakehouses to stay ahead of the curve, while maintaining a unified, cost-effective data platform deployed on your Cloud environment. TL Consulting are a solutions partner with Microsoft in the Data & AI domain. We offer specialised and cost-effective data analytics & engineering services tailored to our customer’s needs to extract maximum business value. Our certified cloud platform & data engineering team are tool-agnostic and have high proficiency working with traditional and cloud-based data platforms and open-source tools. Refer to our service capabilities to find out more.

Harnessing the Power of the Data Lakehouse Read More »

Cloud-Native, Data & AI, , , , , , , , , , , ,

The Modern Data Stack with dbt Framework

In today’s data-driven world, businesses rely on accurate and timely insights to make informed decisions and gain a competitive edge. However, the path from raw data to actionable insights can be challenging, requiring a robust data platform with automated transformation built-in to the pipeline, underpinned by data quality and security best practices. This is where dbt (data build tool) steps in, revolutionising the way data teams build scalable and reliable data pipelines to facilitate seamless deployments across multi-cloud environments. What is a Modern Data Stack? The term modern data stack (MDS) refers to a set of technologies and tools that are commonly used together to enable organisations to collect, store, process, analyse, and visualise data in a modern and scalable fashion across cloud-based data platforms. The following diagram illustrates a sample set of tools & technologies that may exist within a typical modern data stack: The modern data stack has included dbt as a core part of the transformation layer. What is dbt (data build tool)? dbt (i.e. data build tool) is an open-source data transformation & modelling tool to build, test and maintain data infrastructures for organisations. The tool was built with the intention of providing a standardised approach to data transformations using simple SQL queries and is also extendible to developing models using Python. What are the advantages of dbt? It offers several advantages for data engineers, analysts, and data teams. Key advantages include: Overall, dbt offers a powerful and flexible framework for data transformation and modeling, enabling data teams to streamline their workflows, improve code quality, and maintain scalable and reliable data pipelines in their data warehouses across multi-cloud environments. Data Quality Checkpoints Data Quality is an issue that involves a lot of components. There are lots of nuances, organisational bottlenecks, silos, and endless other reasons that make it a very challenging problem. Fortunately, dbt has a feature called dbt-checkpoint that can solve most of the issues. With dbt-checkpoint, data teams are enabled to: Data Profiling with PipeRider Data reliability just got even more reliable with better dbt integration, data assertion recommendations, and reporting enhancements. PipeRider is an open-source data reliability toolkit that connects to existing dbt-based data pipelines and provides data profiling, data quality assertions, convenient HTML reports, and integration with popular data warehouses.  You can now initialise PipeRider inside your dbt project, this brings PipeRider’s profiling, assertions, and reporting features to your dbt models. PipeRider will automatically detect your dbt project settings and treat your dbt models as if they were part of your PipeRider project. This includes – How can TL Consulting help? dbt (Data Build Tool) has revolutionised data transformation and modeling with its code-driven approach, modular SQL-based models, and focus on data quality. It enables data teams to efficiently build scalable pipelines, express complex transformations, and ensure data consistency through built-in testing. By embracing dbt, organisations can unleash the full potential of their data, make informed decisions, and gain a competitive edge in the data-driven landscape. TL Consulting have strong experience implementing dbt as part of the modern data stack. We provide advisory and transformation services in the data analytics & engineering domain and can help your business design and implement production-ready data platforms across multi-cloud environments to align with your business needs and transformation goals.

The Modern Data Stack with dbt Framework Read More »

Data & AI, , , , , , , , ,

Top 5 Data Engineering Techniques in 2023

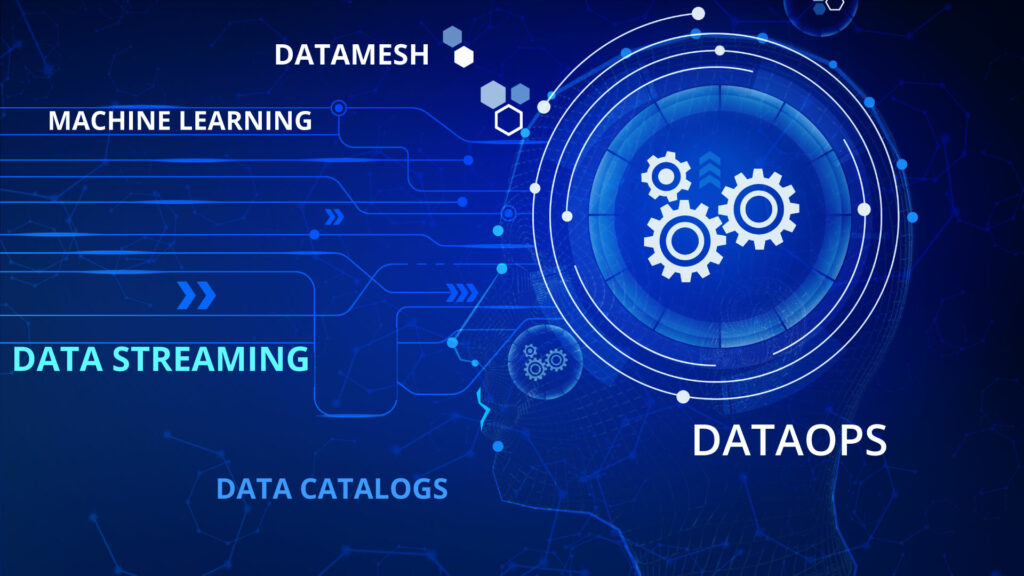
Top 5 Data Engineering Techniques in 2023 Data engineering plays a pivotal role in unlocking the true value of data. From collecting and organising vast amounts of information to building robust data pipelines, it is a complex and vital capability that is becoming more prevalent in today’s complex technology world. There are various intricacies in data engineering, while exploring its challenges, techniques, and the crucial role it plays in enabling data-driven decision making. In this blog post, we explore the top 5 trending data engineering techniques that are expected to make a significant impact in 2023. TL Consulting see Data engineering as an essential discipline that plays a critical role in maximising the value of key data assets. In recent years, several trends and technologies have emerged, shaping the field of data engineering, and offering new opportunities for businesses to harness the power of their data. These techniques enable better and more efficient management of data, unlocking valuable insights and helping enable innovation in a more targeted manner. Since Data engineering is a rapidly evolving domain, there is a continuous need to introduce new data engineering techniques and technologies to handle the increasing volume, variety, and velocity of data. Data Engineering Techniques DataOps One such trend is DataOps, an approach that focuses on streamlining and automating data engineering processes leveraging agile software engineering and DevOps. By implementing DataOps principles, organisations can achieve collaboration, agility, and continuous integration and delivery in their data operations. This approach enables faster data processing and analysis by automating data pipelines, version controlling data artefacts, and ensuring the reproducibility of data processes aligning to DevOps and CICD practices. DataOps improves quality, reduces time-to-insights, and enhances collaboration across data teams while promoting a culture of continuous improvement. DataMesh Another significant trend is Data Mesh, which addresses the challenges of scaling data engineering in large enterprises. DataMesh emphasises domain-oriented ownership of data and treats data as a product. By adopting DataMesh, organisations can establish cross-functional data teams, where each team is responsible for a specific domain and the associated data products. This approach promotes “self-service” data access through a data platform capability, empowering domain experts to manage and govern their data. Furthermore, as the data mesh gains adoption and evolves, with each team that shares their data as products, enabling data-driven innovation. Data Mesh enables scalability, agility, and improved data quality by distributing data engineering responsibilities across the organisation. Data Streaming Real-time data processing has also gained prominence with the advent of data streaming technologies. Data streaming allows organisations to process and analyse data as it arrives, enabling immediate insights and the ability to respond quickly to dynamic business conditions. Platforms like Apache Kafka, Apache Flink, Azure Stream Analytics and Amazon Kinesis provide scalable and fault-tolerant streaming capabilities. Data engineers leverage these technologies to build real-time data pipelines, facilitating real-time analytics, event-driven applications, and monitoring systems to further. This type of capability can lead to optimised real-time stream processing and can gain valuable insights into understanding of customer behaviours and trends. These insights can help you make timely and informed decisions to drive your business growth. Machine Learning The intersection of data engineering and machine learning engineering has become increasingly important. Machine learning engineering focuses on the deployment and operationalisation of machine learning models at scale. Data engineers collaborate with data scientists to develop scalable pipelines that automate the training, evaluation, and deployment of machine learning models. Technologies like TensorFlow Extended (TFX), Kubeflow, and MLflow are utilised to operationalise and manage machine learning workflows effectively. Real-time data streaming offers numerous benefits and empowers you to make informed business decisions. Data Catalogs Lastly, from our experience, Data Catalogs and metadata management solutions have become crucial for managing and discovering data assets. As data volumes grow, organising and governing data effectively becomes challenging. Data cataloguing enables users to search and discover relevant datasets and helps create a single source of knowledge for understanding business data. Metadata management solutions facilitate data lineage tracking, data quality monitoring, and data governance, ensuring data assets are well-managed and trusted. Data cataloguing accelerates analysis by minimising the time and effort that analysts spend finding and preparing data. These trends and technology advancements are reshaping the data engineering landscape, providing organisations with opportunities to optimise their data assets, accelerate insights, and make data-driven decisions with confidence. By embracing these developments, understanding your data assets and associated value, can lead to smarter informed business decisions. By embracing these trending techniques, organisations can transform their data engineering capabilities to enable some of the following benefits: Accelerated data-driven decision-making. Enhanced customer insights, transparency and understanding of customer behaviours. Improved agility and responsiveness to market trends. Increased operational efficiency and cost savings. Mitigated risks through robust data governance and security measures. Data engineering is vital for optimising organisational data assets since these are an important cornerstone of any business. It ensures data quality, integration, and accessibility, enabling effective data analysis and decision-making. By transforming raw data into valuable insights, data engineering empowers organisations to maximize the value of their data assets and gain a competitive edge in the digital landscape. TL Consulting specialises in data engineering techniques and solutions that drive transformative value for businesses enabling the above benefits. We leverage our expertise to design and implement robust data pipelines, optimize data storage and processing, and enable advanced analytics. Partner with us to unlock the full potential of your data and make data-driven decisions with confidence. Visit TL Consulting’s data services page to learn more about our service capabilities and send us an enquiry if you’d like to learn more about how our dedicated consultants can help you.

Top 5 Data Engineering Techniques in 2023 Read More »

Data & AI, , , , ,

Aligning the Correct Data Analytics Model to your Business

Aligning the correct data analytics model to your business needs can lead to a significant return on investment, increased business growth, and better alignment to your business strategy. In addition to financial returns, analytics, and AI can be used to fine-tune business processes and day-to-day operations. In order to leverage the power of data analytics correctly, it’s important for organisations to standardise the way they identify the business questions that need to be answered. Today, many organisations are moving at a rapid pace which sometimes requires timely business decisions to be made. These decisions are sometimes based on the intuition and experience of the business decision-makers, by their current understanding of the business landscape. For data analytics to play a successful role in shaping these decisions, the data presented to the business should add weight and enrichment to ensure the decisions to be made are backed by facts. For this to occur successfully, data analysts need to work cohesively with the business to ensure there is a strong alignment to the business strategy and ensure the right questions are being asked. Taking a holistic approach would help the organisation establish the right process to identify the underlying business problems and then take the appropriate actions, using a data-driven decision-making approach.   4 Major Questions to ask your business A good data analytics model should be aligned to answering a set of business questions to fulfill business requirements. In addition, it’s important for data analysts and data scientists to understand what metrics and KPIs the business needs to measure. What was the cause of the problem? (Reports) Why did it happen? (Diagnosis) What will happen in the future? (Predictions) What is the best way forward? (Recommendations)   What is Data Analytics? Data analytics is the process of utilising quantitative methods to derive actionable insights from data to make informed decisions. There are 4 primary methods of data analysis: Analytics Models deployed in various industries   Type of Analytics: Descriptive   Industry: Education Many LMS platforms and learning systems offer descriptive analytical reporting capabilities with the aim of helping businesses and institutions measure learner performance to ensure that training goals and targets are met. Descriptive Analytics was used to track course enrollments, and course compliance rates, record which learning resources are accessed, collate course survey results, and identify the length of time that learners took to complete a course among other activities Type of Analytics: Diagnostic   Industry: Retail A retail store that sells eco-friendly products noticed a recent surge in revenue from one state. During discovery, the company learned that the surge was driven by a leap in sales of a single product. Research revealed the causal relationship: the state’s governor had signed a law making plastic shopping bags illegal, causing sales of reusable bags to soar. Type of Analytics: Predictive   Industry: E-commerce E-commerce websites are predicting customer preferences and recommend products to customers based on past purchases and search history using state-of-the-art artificial intelligence algorithms. Type of Analytics: Prescriptive   Industry: Insurance Insurance companies want to observe clients who want fast and reliable customer service online. Based on the pricing and premium information for clients, they are prescribing the right pricing and premium information using AI models. However, there are considerations regarding privacy-enhancing technologies (PETS) that allow the AI models to train on homomorphic encrypted data by taking data privacy into account. Businesses can easily adopt a data analytics model to enhance the way they do business. Here is an example of a data analytics lean canvas model encompassing an end-to-end solution shared below:   Conclusion In conclusion, for organisations to extract meaningful insights from their data to make the right decisions about their business, the correct data analytics model eliminates guesswork and manual tasks, be it choosing the right content or developing the right products to your customer needs. TL Consulting provides advisory and transformation services in the data analytics & engineering domain and can help your business design and implement the correct-fit data analytics model aligned to your business needs and transformation goals. Read through our data engineering and data platforms page to learn more about our service capabilities and send us an enquiry if you’d like to learn more about how our dedicated consultants can help you.

Aligning the Correct Data Analytics Model to your Business Read More »

Data & AI, , ,

Key Considerations When Selecting a Data Visualisation Tool

Data visualisation is the visual representation of datasets that allows individuals, teams and organisations to better understand and interpret complex information both quickly and more accurately. Besides considering the cost of the tool itself, there are other key considerations when selecting a data visualisation tool to implement within your business. These include: Identifying who are the end-users that will be consuming the data visualisation What level of interactivity, flexibility and availability of the data visualisation tool is required from these users?   What type of visualisations are needed to fit the business/problem statement and what type of analytics will drive this?  Who will be responsible for maintaining and updating the dashboards and reports within the visualisation tool? What is the size of the datasets and how complex are the workloads to be ingested into the tool? Is there an existing data pipeline setup or does this need to be engineered? Are there any requirements to perform pre-processing or transformation on the data before it is ingested into the data visualisation tool? The primary objective of data visualisation is to help individuals, teams and companies explore, monitor and explain large amounts of data by organizing and allowing for more efficient analysis and decision-making by enabling users to quickly identify patterns, correlations, and outliers in their data.  Data visualisation is an important process for data analysis and other interested parties as it can provide insights and uncover hidden patterns in data that may not be immediately apparent through either tabular or textual representations. With data visualisation, data analysts and other interested parties such as business SMEs can explore large datasets, identify trends from these datasets, and communicate findings with stakeholders more effectively.      There are many types of data visualisations that can be used depending on the type of data being analysed along with the purpose of the analysis. Common types of visualisations include graphs, bar charts, line scatter plots, heat maps, tree maps, and network diagrams.  For data visualisation to be effective, it requires careful consideration of the data being presented, the intended audience, and the purpose of the analysis. The visualisation that is being presented should be clear, concise, and visually appealing, with labels, titles, and colours used to highlight important points and make the information more accessible to the audience. The data visualisation needs to an effective storytelling mechanism for all end-users to understand easily. Another consideration is the choice of colours used, as the wrong colours can impact the consumers of the data visualisation and can impact visually impaired people (i.e., colour blindness, Darker vs Brighter contrasts as examples)  In recent years, data visualisation has become increasingly important as data within organisations continues to grow in complexity. With the advent of big data and machine learning technologies, data visualisation is playing a critical role in helping organisations make sense of their data, and become more data-driven with increased ‘time to insight’, as organisations facilitate better and faster decision-making.    Data Visualisation Tools & Programming Languages  At TL Consulting, our skilled and experienced data consultants use a broad range and variety of data visualisation tools to help create effective visualisations of our customer’s data. The most common are listed below:   Power BI is a business intelligence tool from Microsoft that allows users to create interactive reports and dashboards using data from a variety of sources. It includes features for data modelling, visualisation, and collaboration.  Excel: Excel is a Microsoft spreadsheet application and from a data visualisation perspective includes the capability to represent numerical data in a visual format.  Tableau: Tableau is a powerful data visualisation tool that allows users to create interactive dashboards, charts, and graphs using drag-and-drop functionality. It supports a wide range of data sources and has a user-friendly interface.  QlikView: QlikView is a first-generation business intelligence tool that allows users to create interactive visualisations and dashboards using data from a variety of sources. QlikView includes features for data modelling, exploration, and collaboration.  Looker:  Looker is a cloud-based Business Intelligence (BI) tool that helps you explore, share, and visualise data that drive better business decisions. Looker is now a part of the Google Cloud Platform. It allows anyone in your business to analyse and find insights into your datasets quickly.  Qlik Sense: Qlik Sense is the next-generation platform for modern, self-service-oriented analytics. Qlik Sense supports from self-service visualisation and exploration to guided analytics apps and dashboards, conversational analytics, custom and embedded analytics, mobile analytics, reporting, and data alerting.      In conjunction with the data visualisation tools listed above, there are a variety of programming languages using their various libraries that TL Consulting use in delivering outcomes to our customers that support not just Data Visualisation but also Data Analytics.  Python is a popular programming language that can be used for data analysis and visualisation. This can be done via tools such as Jupyter, Apache Zeppelin, Google Colab and Anaconda to name a few. Python includes libraries such as Matplotlib, Seaborn, Bokeh and Plotly for creating visualisations.  R is a programming language used for statistical analysis and data visualisation. It includes a variety of packages and libraries for creating charts, graphs, and other visualisations.  Scala is a strong statically typed high-level general-purpose programming language that supports both object-oriented programming and functional programming. Scala has several data visualisation libraries such as breeze-viz, Vegas, Doodle and Plotly Scala.  Go or Golang is a statically typed, compiled high-level programming language designed at Google. Golang has several data visualisation libraries that facilitate the creation of charts such as pie charts, heatmaps, scatterplots and boxplots.  JavaScript is a popular programming language that is a core client-side language of the w3.  It has rich data visualisation libraries such Chart JS, D3, FusionCharts suite, Pixi etc.      Conclusion In conclusion, there are several data visualisation tools and techniques available in the market. For organisations to extract meaningful insights from their data in a time-efficient manner, it’s important to consider these factors before selecting and implementing a new data visualisation tool for your business. TL

Key Considerations When Selecting a Data Visualisation Tool Read More »

Data & AI, , , , , , , ,